Stats chart
Shows how everyone else answered the thesis the taker just answered, when their answer turns out to be a rare one.
Decision: ⚪ idea
Design: Figma
Context
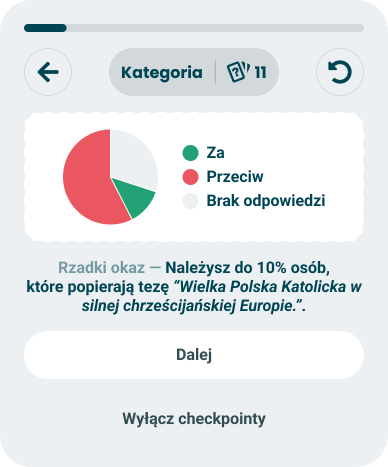
A passive card built on the population rather than on the taker's scores. It draws how every taker so far answered one specific thesis and names where this taker sits in that split. "Rare specimen - you are among the 10% of people who support the thesis 'A great Catholic Poland in a strong Christian Europe.'"
This is the rarity branch of the event model, and the only checkpoint whose trigger is not a score.
How it behaves:
- Reuses the statistics module - the same chart and the same aggregates as module statistics on the result screen.
- Three slices, skips included - for, against, and no answer, so the share is counted against everyone who saw the question, not only against those who answered it.
- The thesis is quoted verbatim - the card is about one concrete claim rather than an axis, and the quote is what makes the percentage mean anything.
- Fires on rarity, not on standing - the trigger is how few takers share the answer, so it can fire on any question in any quiz.
- Rarity cuts both ways - a rare agreement and a rare disagreement are the same event, and the copy has to carry both without changing tone.
- Passive - continue, plus the checkpoint opt-out every card carries.
Opportunity
- The only card that says something nobody else can - it needs a population behind it, which no single quiz can fake and no competitor in Poland has - see the data module.
- It flatters without judging - "rare" is a compliment shaped like a statistic, and it praises the position without endorsing the view.
- It cannot be overturned - the claim is about a thesis's popularity, not about the taker, so unlike every other checkpoint the final result cannot contradict it.
- It works on any question - no axis, no confidence gate, no author configuration.
- It makes the dataset visible - the taker sees there is a real population behind the product, which is the argument for everything the data module sells.
Risk
- Live aggregates are expensive or stale - the number has to be true at the moment it is shown, and computing it mid-quiz is the cost the event model already flags.
- Small samples invent rarity - a community quiz with forty takers can call anything rare, and the number is wrong in a way nobody can see from the card.
- Skips inflate the number - counting "no answer" in the denominator makes every real answer look rarer than it is, and on a question people avoid, the effect is largest exactly where the card is most likely to fire.
- "Rare" reads as "fringe" - being told that 10% share your view on a religious or national thesis can land as being singled out rather than as being interesting.
- It invites conformity - showing the majority mid-quiz is a social signal, not an analytic one, and it pulls the answers that follow towards the crowd harder than any score-based card would.
- Quoting the thesis airs it twice - a contentious wording gets a second showing with our framing attached to it.
- Rarity moves - the same answer can be rare this month and ordinary the next, so two takers get contradictory cards for the same position.